Your Money, Your Update
A Quarterly Review of Investment Trends and Strategy From Our Investment Committee
Quarter 2, 2026
Join Sayer Martin, CFA, and John Burke, as they discuss their perspectives on key market developments heading into the third quarter of 2026, including a broad market overview, shifting leadership beyond mega-cap stocks, continued investment in AI, and interest rates that may remain elevated. They also share perspective on sector performance, fixed income markets, and current conditions shaping the investment landscape.
*Filmed on July 1, 2026
Disclosures: This material is for informational purposes only and should not be construed as investment advice or a recommendation. Investment advisory services are offered through Stone House Investment Management, LLC, an SEC-registered investment adviser. Registration with the SEC does not imply a certain level of skill or training. Investing involves risk, including the potential loss of principal. Past performance does not guarantee future results. Forward-looking statements reflect our current views as of July 1, 2026 (the recording date) and are subject to change. This is not an offer to buy or sell any security. Indexes are unmanaged and cannot be invested in directly.
Q2 2026 Review
As our first-quarter update went to press, markets were near their lows and the Iran conflict was unresolved. The S&P 500 had given back its early-year gains, oil had spiked on fears that supply through the Strait of Hormuz would be choked off, and the mood was defensive. As we noted then, the key variable was duration — how long the disruption would last. The second quarter answered that question, and the answer drove one of the sharpest market recoveries in two decades.
From its closing low on March 30, the S&P 500 rallied roughly 20% over the following nine weeks to a fresh record high on June 2, then eased back into quarter-end. The catalyst was de-escalation: the United States and Iran moved toward a framework in mid-June, the Strait of Hormuz reopened to tanker traffic, and Brent crude fell more than 10% in a single week to around $72 — its lowest level since late February. The situation remains fragile and headline-driven, but the direction of travel through the quarter was toward resolution, and markets responded in kind.
The discussion above is provided for informational and market commentary purposes only and should not be interpreted as a prediction, guarantee, or assurance regarding future market events or investment outcomes.
Q2 2026 Market Performance Overview
Year-to-date total price returns through June 30, 2026:
- U.S. Stocks: +9.5% (The S&P 500 recovered its spring losses and set a record high on June 2 before easing into quarter-end — an ordinary headline number that masked an extraordinary three months.)
- Magnificent 7: -2.5% (The largest technology leaders lagged as the market stopped paying for AI spending and started rewarding its suppliers.)
- AI Semiconductors: +113% (The chip complex was the year’s standout as demand for AI infrastructure surged.)
- Small Caps: +22.1% (The Russell 2000 led a broadening market, far outpacing the mega-cap-heavy headline index.)
- U.S. Bonds: -0.9% (The U.S. Aggregate index was roughly flat as yields drifted higher under a more hawkish Federal Reserve.)
- Gold: -7% (Gold gave back ground year-to-date as the new Fed’s hawkish turn pressured traditional inflation hedges.)
Source and methodology note: U.S. Stocks reflects S&P 500 total price return. Magnificent 7 reflects MAGS ETF. AI Semiconductors reflects SOXX ETF (Philadelphia Semiconductor Index), which tracks the broader semiconductor industry and is not limited to AI-focused companies; the figure may not represent AI semiconductor returns precisely. Small Caps reflects Russell 2000 Index. U.S. Bonds reflects Bloomberg U.S. Aggregate Bond Index. Gold reflects spot price return. ETF returns reflect price return and may differ from underlying index total returns. All figures are year-to-date through June 30, 2026. See Sources section for detail. Shown for informational purposes only; not a recommendation.
References to specific securities or issuers are for illustrative purposes only and do not constitute a recommendation to buy, sell, or hold any security. Index and ETF performance is provided for illustrative purposes only. Indices are unmanaged, and it is not possible to invest directly in an index. Returns do not reflect the deduction of advisory fees, transaction costs, or other expenses. Past performance does not guarantee future results.
From War Scare to Record Highs
The path the market took is instructive. After bottoming on March 30, the S&P 500 climbed about 20% from its closing low to a record high on June 2, then gave back roughly 2% into quarter-end. Intraday, the trough-to-peak move was closer to 25%.
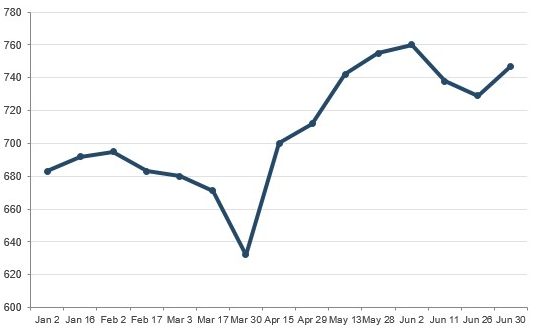
Source: S&P 500 (SPY), daily closing prices, January–June 2026.
By the numbers, it was a historic stretch. The S&P 500 gained roughly 14.9% in the quarter — its best since the spring of 2020. It posted its first close above 7,000 in mid-April, notched about twenty record highs between then and the June 2 peak, and completed the round trip from a 9% decline back to new highs in roughly three weeks — the fastest rebound from a drop that deep since at least 2006.
This followed, in part, the playbook we discussed last quarter. Our own historical work on past oil shocks and military conflicts suggested that supply-driven disruptions, once they de-escalate, have more often than not been followed by market recoveries — and that outcomes generally depended on the disruption easing within a matter of months rather than dragging on. That is broadly how the second quarter unfolded. History offers perspective, not certainty, and we hold these comparisons loosely — but the pattern held this time.
It also helps to step back and put the year in context. The S&P 500 returned roughly 26%, 25%, and 18% in 2023, 2024, and 2025 — three of the strongest years in a row that investors have seen. Against that backdrop, a roughly 10% 2026 is less a disappointment than a return to a more normal pace.
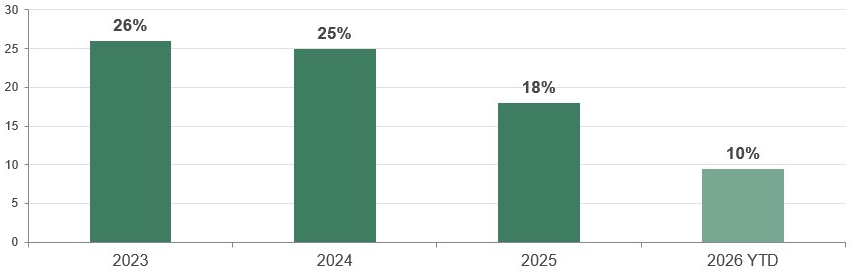
Source: S&P 500 calendar-year total returns, 2023–2025, with 2026 year-to-date (lighter bar) through June 30.
Mega-Cap Technology, AI, and the IPO Wave
Behind the headline recovery sits a single dominant force: the build-out of artificial intelligence. The largest technology companies are on track to spend roughly $527 billion on AI this year. To put that in perspective, AI spending has added more to U.S. economic growth over the past two quarters than all consumer spending combined — 1.4% of the 2.0% total GDP growth in Q1 alone. It is also showing up in profits. Earnings for the 500 largest U.S. companies grew about 10–11% in each of 2024 and 2025; for 2026, analysts now expect roughly 24% — a figure that has effectively doubled since the start of the year.
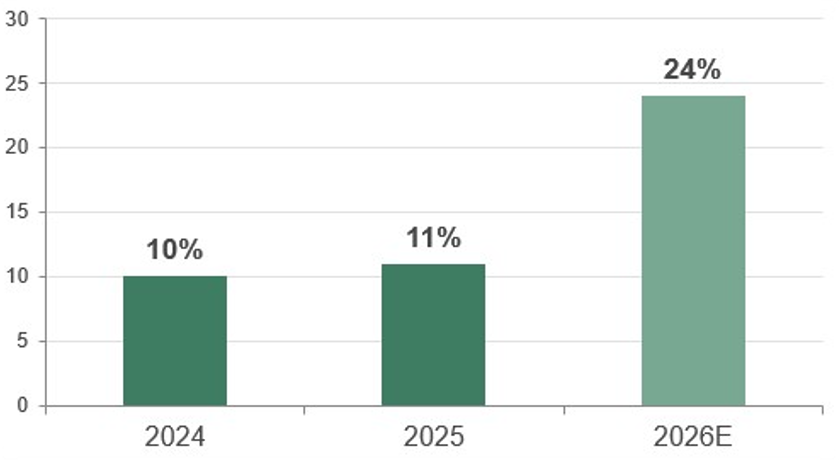
Source: S&P 500 year-over-year earnings growth; 2026 (lighter bar) is the current consensus estimate.
But the rules of the game changed this quarter, and that is the more important development. For two years, simply mentioning AI on an earnings call was enough to lift a stock. That stopped. Today only about one in five S&P 500 companies cites a measurable benefit from AI, and the market has begun to reward results over rhetoric. The clearest evidence is in who got paid: the market became more skeptical of the Magnificent 7 mega-caps doing the spending and began richly rewarding the companies supplying the build-out. Memory chips, networking gear, servers, and power equipment — the unglamorous “picks-and-shovels” of AI — have been the year’s biggest winners, while several of the largest and most familiar names actually declined.
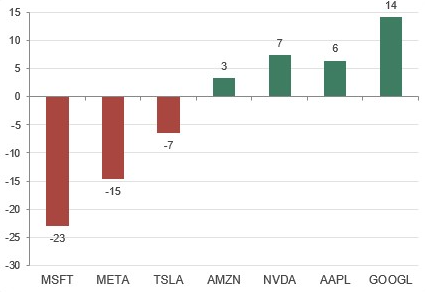
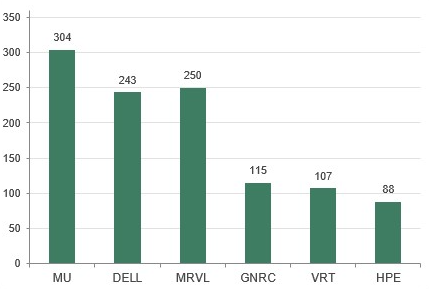
Source: Year-to-date total price returns. AI “spenders” (left) versus AI “suppliers” (right). Shown for illustration, not as recommendations.
There is a quieter, more structural change underneath this. The companies at the top of the index built their reputations — and their premium valuations — on being “capital-light.” That is no longer what the financial statements show. In their most recent fiscal year, the four largest spenders (Microsoft, Alphabet, Amazon, and Meta) spent about 2.6 times their depreciation on new capacity, up from roughly 1.6 times in 2020, and their free cash flow fell to about 53% of net income, from essentially 100% in 2020. These are beginning to look less like capital-light software businesses and more like capital-intensive infrastructure.
The AI boom is also reaching the new-issue market in historic size. Three of the most valuable private companies in the world moved toward public markets this quarter: SpaceX priced in mid-June, raising roughly $75 billion in the largest IPO in history; OpenAI filed confidentially, with reported valuations near $1 trillion, though its listing now appears to be sliding into 2027; and Anthropic filed a draft registration and could list as soon as October, having most recently raised capital at a $965 billion valuation. Combined, these three alone could raise more than $200 billion — versus roughly $45 billion for the entire U.S. IPO market in all of 2025. That is a great deal of new supply, and supply has consequences, as we note below.
In our view, AI remains one of the most important long-term themes in investing. But this quarter was a reminder that even transformative technology can produce uneven investment outcomes. We remain constructive on the opportunity, and selective about where we take the risk.
A Concentrated Market Broadens Out
For all the recovery, the index itself remains strikingly top-heavy. About 40% of the S&P 500’s entire market value now sits in just ten companies — Nvidia alone is roughly 8% — against a thirty-year average closer to 25%. The concentration of earnings is even more pronounced: an estimated 64% of this year’s profit growth comes from those same ten companies, with Nvidia and Micron together accounting for roughly a third of that amount.
The practical implication is simple: when a market leans this heavily on a handful of names, a stumble by one or two can move the whole index. And it cuts both ways beneath the surface — even after this year’s gains, about a third of the index’s members still sit more than 20% below their own 52-week highs. There is, in effect, a quiet bear market sitting inside a record-setting index.
The encouraging counterpoint, and one of the most important themes of the quarter, is that participation is widening. The equal-weighted S&P 500 (up about 11%) is beating the cap-weighted index (up 9.5%) — meaning the average stock is outpacing the mega-cap-dominated headline. Small- and mid-caps, up roughly 22% and 15%, are leading. Value is beating growth by about 8 percentage points, still a wide margin. And the rest of the world is contributing: emerging markets are up about 25% this year and have compounded roughly 64% since the start of 2025, against about 27% for the S&P. This broadening of leadership is something we have been watching for several quarters, and it is another reminder that diversification continues to matter.

Source: Year-to-date total price returns: factor and size segments versus the cap-weighted S&P 500 and growth.
Diversification does not ensure a profit or protect against loss in declining markets. Past performance does not guarantee future results.
Sector Winners and Losers
Beneath the surface, the quarter was defined by a very wide gap between sectors that benefit from the current environment and those that do not. Technology led, up about 32%, on the AI-infrastructure complex. Energy rose roughly 19% on oil’s war-driven premium, industrials gained about 19% on power, grid, and defense demand, materials added about 12% as inputs for the data-center build, and real estate rose about 9% as the rate path came into clearer view.
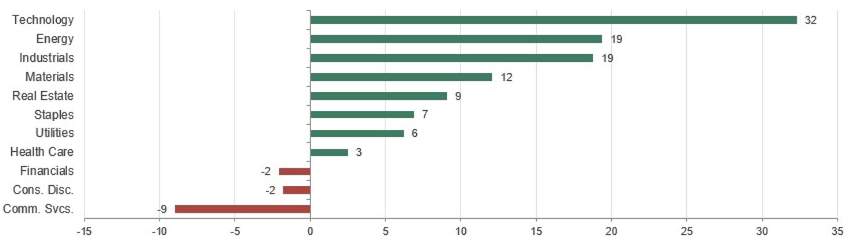
Source: S&P 500 sector total price returns, year-to-date through June 30, 2026 (GICS sector SPDR ETFs).
On the weaker side of the ledger, communication services fell nearly 9%, dragged down by Meta; consumer discretionary declined about 2% on a cautious consumer and a weak Tesla; and financials slipped about 2% on uncertainty around the path of interest rates. Health care and utilities lagged the cyclical leaders. In other words, this was not a uniform advance — it was a quarter that rewarded certain business models and penalized others, and what you owned mattered far more than simply being “in the market.”
Valuations and a Few Warning Shots
None of this is happening cheaply. Around the dot-com era, Warren Buffett popularized a simple gauge in Fortune magazine — the total value of U.S. stocks measured against the size of the economy, now widely known as the “Buffett indicator.” At the dot-com peak it reached about 145% of GDP; today it sits near 230%. That comparison isn’t quite apples-to-apples anymore, though: a far larger share of S&P 500 revenue now comes from overseas so measuring an increasingly global business against U.S. output alone overstates how stretched the market looks, and overstates it more now than it did in 2000.
Adjusting for that, by counting only the U.S. share of those sales, puts the market near 140% of GDP today versus about 105% at the dot-com peak — a roughly 40% haircut to the headline. Importantly, it doesn’t change the conclusion: even after accounting for globalization, valuations remain elevated by historical standards and still sit above the dot-com peak.
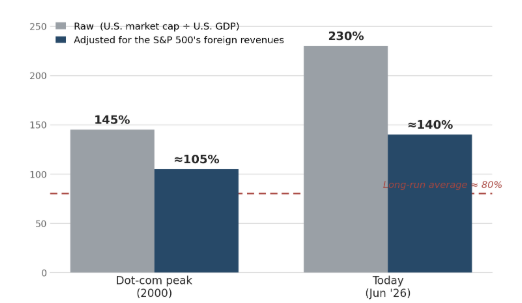
Source: Buffett indicator (total U.S. stock-market value ÷ GDP), raw versus adjusted for the S&P 500’s foreign revenues. Adjusted figures scale the raw ratio by the index’s estimated domestic revenue share (≈60% today, ≈72% in 1999). Estimates; methodologies vary.
Corporate profits are also near their highest share of the economy since 1950. High valuations don’t tell you when anything will happen, but they do tell you that a great deal of good news is already priced in — which leaves less room for error. The quarter offered a couple of reminders. AI-chip stocks fell sharply over two days in late June on fresh doubts about the payoff from all this spending, and several headline IPOs “popped and faded”: SpaceX and Cerebras have given back roughly 24% and 53% from their post-listing peaks. And the $200-billion-plus of new IPO supply noted earlier can itself pull money out of stocks investors already own. When expectations are this high, surprises tend to hurt more than they help.
The New Fed Under Warsh
One of the biggest changes to the backdrop this quarter came from Washington. The Federal Reserve, under new Chair Kevin Warsh — confirmed in the closest vote in the central bank’s history — held its policy rate at 3.50-3.75% for a fourth straight meeting and, more strikingly, reversed the direction of its guidance. In March, most Fed officials still expected rate cuts this year. By June, nine of eighteen expected a hike, and only one a cut; futures markets put the odds of a rate hike by year-end around 70%. Core inflation, near 3.3%, remains above the Fed’s 2% goal. “Inflation is a choice,” Mr. Warsh has said — a clear signal of a Fed focused more on price stability than on cushioning markets.
That shift has had real consequences for the assets investors often buy as inflation hedges. Around Mr. Warsh’s nomination in late January, gold fell about 16% intraday, silver about 31%, and Bitcoin continued to draw down; year-to-date, those hedges remain down (gold about 7%, silver 17%, Bitcoin 33%). It is a useful reminder that “safe havens” are not one-way bets. The plain takeaway: we are not counting on the Fed to ride to the rescue with rate cuts, and we are planning for the possibility that rates stay higher for longer.
Fixed Income Markets
Bonds have had an unremarkable year in terms of returns — the broad U.S. Aggregate index is essentially flat — but the setup is the most attractive it has been in some time. Yields rose over the first half as the oil shock, sticky inflation, and a more hawkish Fed pushed the 10-year Treasury from about 4.0% toward 4.4%, with the 30-year briefly back above 5% before easing. Because bond prices fall as yields rise, those higher yields held total returns roughly flat — investment-grade corporates were down about 1.0%, high yield down about 0.8%, and long Treasuries down about 0.8%.
But higher yields are exactly what makes bonds more appealing going forward. Starting yields are the highest in two decades, so income — not price appreciation — now does the heavy lifting; a coupon above 5% can absorb modest price moves and still deliver a positive return. We favor higher-quality, intermediate-term bonds, and we are cautious on lower-quality debt, where the extra yield is unusually thin and investors are not being paid much for the added risk. We continue to believe fixed income has an important role to play in portfolios.
Outlook and Positioning
The second quarter of 2026 was a powerful reminder that markets rarely move in straight lines. Just a few months ago, the focus was on oil supply, military conflict, and inflation pressure. By quarter-end, attention had shifted to record highs, AI earnings, and how aggressive a new Federal Reserve might be.
We don’t know how durable the Iran truce will prove, whether the Fed will hike again this year or hold, or how quickly AI investment will translate into the earnings the market is now demanding. What we do know is that markets have worked through difficult geopolitical and economic shocks before, and that disciplined, diversified investors have historically been better positioned to navigate periods like these — although outcomes can vary.
That conviction shapes how we are thinking about risk and opportunity. The rally is real, but it is still narrow and richly valued, so we continue to lean on broad diversification rather than crowding into a few winners. Within fixed income we prefer higher-quality, intermediate-term bonds over reaching for yield in riskier credit. We remain constructive on AI as a long-term theme but selective about where we take the risk, weighing those investments on their earnings rather than their narratives.
It is worth remembering that volatility is normal — the S&P 500 has historically seen an average intra-year drawdown of roughly 14%, and this year’s spring scare was a textbook example. When valuations are full, markets have less room for error, which is all the more reason to stay diversified and keep short-term headlines in perspective. As always, our focus remains on navigating market shifts thoughtfully, adjusting portfolios where appropriate, and helping you stay invested through the noise. Thank you for your continued confidence.
Sources
Market & index returns: Slickcharts — S&P 500 annual returns https://www.slickcharts.com/sp500/returns; Macrotrends — historical annual returns https://www.macrotrends.net/2526/sp-500-historical-annual-returns; Morningstar — S&P 500 performance https://www.morningstar.com/indexes/spi/spx/performance; Magnificent 7: MAGS ETF, Semiconductors: SOXX ETF
Federal Reserve & policy: U.S. Federal Reserve — June 17, 2026 FOMC statement https://www.federalreserve.gov/newsevents/pressreleases/monetary20260617a.htm; CNBC — Fed rate decision https://www.cnbc.com/2026/06/17/fed-interest-rate-decision-june-2026.html; NPR — Chair Warsh’s first FOMC https://www.npr.org/2026/06/17/nx-s1-5860084/fed-chief-warsh-first-fomc-meeting; Trading Economics; U.S. Bank Asset Management Group
AI earnings & 2026 EPS consensus: Goldman Sachs — 2026 S&P 500 outlook https://www.goldmansachs.com/insights/articles/s-and-p-500-forecast-to-climb-as-earnings-growth-powers-stocks-higher; FactSet — Earnings Insight https://www.factset.com/earningsinsight; FactSet — CY2026 preview (year-start estimate) https://insight.factset.com/sp-500-cy-2026-earnings-preview-analysts-expect-earnings-growth-of-15
AI IPO wave (SpaceX / OpenAI / Anthropic): U.S. SEC (EDGAR) filings; CNBC; Reuters; Bloomberg; Morningstar; The Motley Fool https://www.fool.com/investing/2026/06/23/spacex-anthropic-openai-go-public-2026-buy/
Market concentration: RBC Wealth Management / FactSet — “The Great Narrowing” https://www.rbcwealthmanagement.com/en-us/insights/the-great-narrowing-sp-500-concentration; Goldman Sachs via Seeking Alpha — Nvidia + Micron ≈ ⅓ of growth https://seekingalpha.com/news/4597487-nvidia-micron-set-to-power-a-third-of-sp-500-earnings-growth-in-2026—goldman; GHPIA — Concentration at the Top https://ghpia.com/sp-500-concentration-implications-for-investors/
Valuation (Buffett indicator, profits/GDP): GuruFocus — market cap ÷ GDP https://www.gurufocus.com/economic_indicators/4602/usa-ratio-of-total-market-cap-over-gdp; Advisor Perspectives / dshort — Buffett valuation indicator https://www.advisorperspectives.com/dshort/updates/2026/06/03/buffett-valuation-indicator-may-2026; FRED / U.S. BEA — corporate profits after tax ÷ GDP https://fred.stlouisfed.org/graph/?g=1Pik
Digital assets: CoinMarketCap — Bitcoin historical price data, https://coinmarketcap.com/currencies/bitcoin/historical-data/; StatMuse Money — Bitcoin closing price December 31, 2025, https://www.statmuse.com/money/ask/bitcoin-price-december-31.-2025
Research & strategy: Bridgewater Associates; Morgan Stanley; UBS; Renaissance Macro Research; Fidelity; Charles Schwab; Vanguard; S&P Dow Jones Indices
Stone House proprietary research: Historical analysis of oil shocks and military conflicts (12 episodes, 1962–2026), informing our perspective on market behavior following such events
Disclosures
The information contained herein is for informational purposes only and should not be considered investment advice or a recommendation to buy or sell any security. Past performance is not indicative of future results. Investing involves risk, including the potential loss of principal.
Index performance is provided for comparison purposes only. Indices are unmanaged, and it is not possible to invest directly in an index. Index returns do not reflect the deduction of advisory fees, transaction costs, or other expenses, which would reduce performance. Some figures in this report reflect ETF total price returns (including MAGS and SOXX) used as proxies for market segments; ETF returns may differ from underlying index total returns due to management fees, tracking error, and differences in constituent composition. The “AI Semiconductors” figure reflects the SOXX ETF, which tracks the broader semiconductor industry and is not limited to AI-focused companies.
This material may contain forward-looking statements based on current expectations, estimates, projections, and opinions of Stone House Investment Management, LLC as of the date indicated. Such statements are subject to change without notice and actual results may differ materially.
Diversification does not ensure a profit or protect against loss in declining markets.
Data and statistics are obtained from sources believed to be reliable, but Stone House Investment Management, LLC does not guarantee their accuracy or completeness.
Investment advisory services are offered through Stone House Investment Management, LLC, an SEC-registered investment adviser. Registration with the SEC does not imply a certain level of skill or training.